

Introduction
If you’ve ever searched for a stock price on Google, you’ve already used Google Finance—even if you didn’t realize it.
It’s like having a mini stock market dashboard built right into your browser. No complicated tools, no confusing layouts—just clean, real-time data at your fingertips.
But here’s the real question:
Is Google Finance just a quick lookup tool, or can it actually help you become a smarter investor?
In this detailed guide, we’ll explore everything—from real-time stock prices and historical charts to how you can use Google Finance like a pro.
Table of Contents
| Sr# | Headings |
|---|---|
| 1 | What is Google Finance? |
| 2 | How Google Finance Works |
| 3 | Real-Time Stock Prices Explained |
| 4 | Live Quotes and Market Data |
| 5 | Historical Charts and Trends |
| 6 | Key Features of Google Finance |
| 7 | How to Read Stock Charts |
| 8 | Google Finance vs Yahoo Finance |
| 9 | Tracking Your Portfolio |
| 10 | Global Market Coverage |
| 11 | Advantages of Google Finance |
| 12 | Limitations of Google Finance |
| 13 | How Beginners Can Use It |
| 14 | Future of Google Finance |
1. What is Google Finance?
Google Finance is a free online tool that provides:
- Real-time stock prices
- Financial news
- Historical data
- Portfolio tracking
It covers global markets, including:
- US stocks (NASDAQ, NYSE)
- Indian stocks (NSE, BSE)
- International markets
Think of it like a financial GPS—it shows you where the market is and helps guide your investment journey.
2. How Google Finance Works
Google Finance collects data from stock exchanges and financial data providers.
How it delivers information:
- Real-time or slightly delayed quotes
- Interactive charts
- News integration
When you search a stock (like “GOOGL stock”), Google instantly shows:
- Current price
- Day change
- Market cap
- Chart
3. Real-Time Stock Prices Explained
Real-time prices mean:
- Prices update instantly (or near real-time)
- Reflect actual market trades
For example, Alphabet Inc. stock (GOOGL) shows:
- Live price movement
- Intraday highs and lows
- Volume
This helps traders make quick decisions.
4. Live Quotes and Market Data
A stock quote includes:
Key Data Points:
- Current price
- Change (% and value)
- Open price
- High/Low
- Volume
These numbers tell you how a stock is performing at that moment.
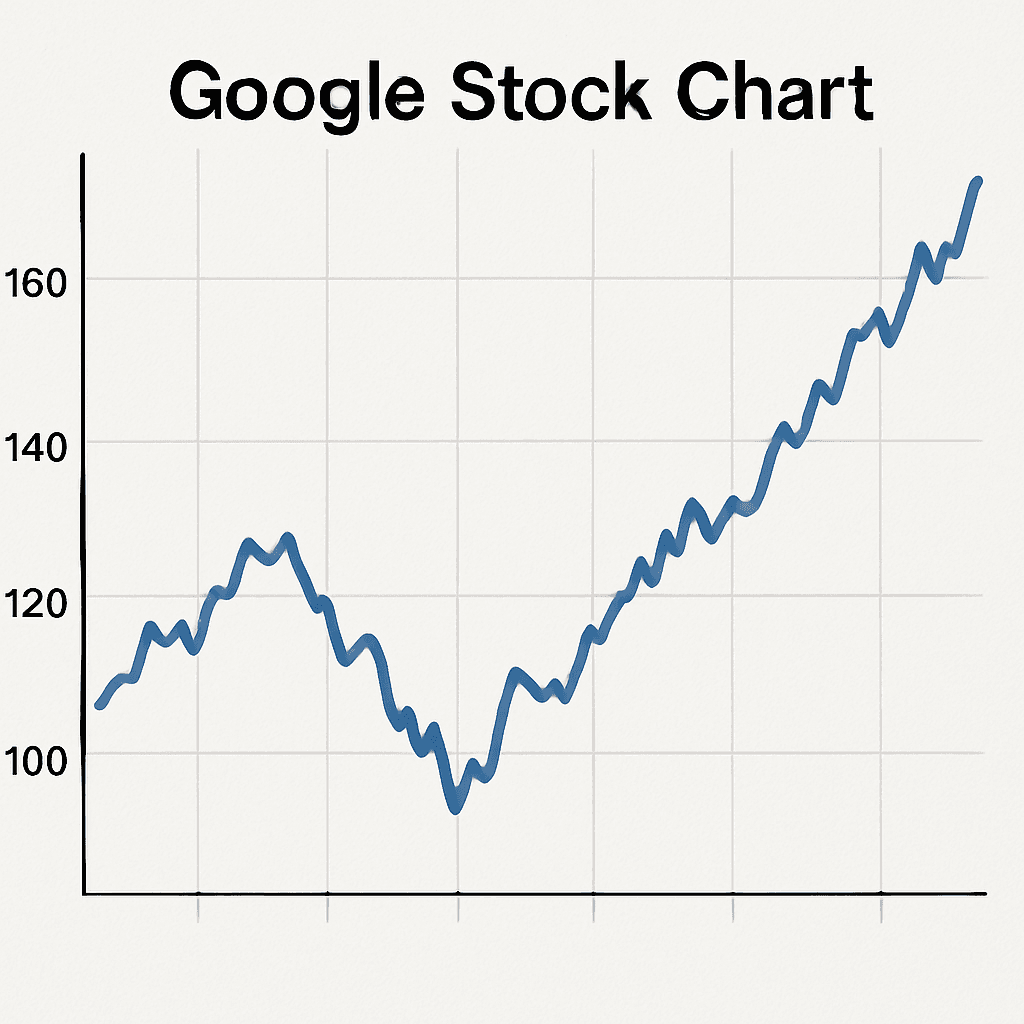
5. Historical Charts and Trends
One of the most powerful features is historical data.
Timeframes Available:
- 1 Day
- 5 Days
- 1 Month
- 1 Year
- 5 Years
- Max
Historical charts help you:
- Identify trends
- Spot patterns
- Compare performance
It’s like looking at a company’s “life story” instead of just today’s mood.

6. Key Features of Google Finance
1. Interactive Charts
Zoom in and out of price movements easily.
2. Portfolio Tracking
Track your investments in one place.
3. News Integration
See the latest financial news linked to stocks.
4. Comparison Tool
Compare multiple stocks side by side.
7. How to Read Stock Charts
Charts may look complex, but they’re simple once you understand them.
Key Elements:
- Price Line: Shows movement over time
- Volume Bars: Show trading activity
- Time Axis: Displays timeline
Simple Tip:
- Rising chart = bullish trend
- Falling chart = bearish trend
8. Google Finance vs Yahoo Finance
Both platforms are popular.
Google Finance:
- Clean interface
- Easy to use
- Quick access
Yahoo Finance:
- More detailed data
- Advanced tools
- Financial statements
Think of it like:
- Google Finance = Simple dashboard
- Yahoo Finance = Full control panel
9. Tracking Your Portfolio
You can create your own portfolio on Google Finance.
Benefits:
- Track multiple stocks
- Monitor performance
- See gains/losses
It’s like having your own investment scoreboard.
10. Global Market Coverage
Google Finance covers:
- US markets
- Indian markets
- European markets
- Asian markets
This makes it useful for global investors.
11. Advantages of Google Finance
Why People Love It:
- Free to use
- Simple interface
- Fast updates
- Integrated with Google Search
Perfect for beginners and casual investors.
12. Limitations of Google Finance
What It Lacks:
- Advanced technical indicators
- Deep financial analysis tools
- Limited customization
Professional traders may need additional platforms.
13. How Beginners Can Use It
If you’re new, start simple:
- Search a stock (e.g., GOOGL)
- Check price and chart
- Read related news
- Track it in your portfolio
Over time, you’ll understand patterns better.
14. Future of Google Finance
With AI and data integration improving, Google Finance could become even more powerful.
Possible future features:
- AI-based insights
- Predictive analytics
- Personalized investment suggestions
Conclusion
Google Finance is one of the simplest and most accessible tools for tracking stock market prices, real-time quotes, and historical data.
It may not replace advanced trading platforms, but it excels at what it’s designed for:
👉 Making financial information easy for everyone
Whether you’re a beginner checking your first stock or someone casually tracking the market, Google Finance is a powerful tool right in your pocket.
FAQs
1. Is Google Finance free to use?
Yes, Google Finance is completely free for all users.
2. Are Google Finance prices real-time?
Most prices are real-time or slightly delayed, depending on the exchange.
3. Can I track my portfolio on Google Finance?
Yes, you can create and monitor your own portfolio.
4. Is Google Finance good for beginners?
Absolutely—it’s one of the easiest platforms to start with.
5. Does Google Finance show global stocks?
Yes, it covers markets worldwide, including the US, India, and Europe.